
Design and Inspect Mode
Learn more about the two modes available in Canvas to help you design and inspect flows.
Canvas has two different modes: Design and Inspect. By default, it opens in Design Mode, where you create and edit on your flow. When you execute the flow, Inspect Mode is activated to help you trace the path of execution and see more information about each connector.
Design Mode
Design Mode is where you do your work. In this mode you configure the connectors and create the flow. While you are creating your flow and before you run the first execution, only the Design Mode is active.
Inspect Mode
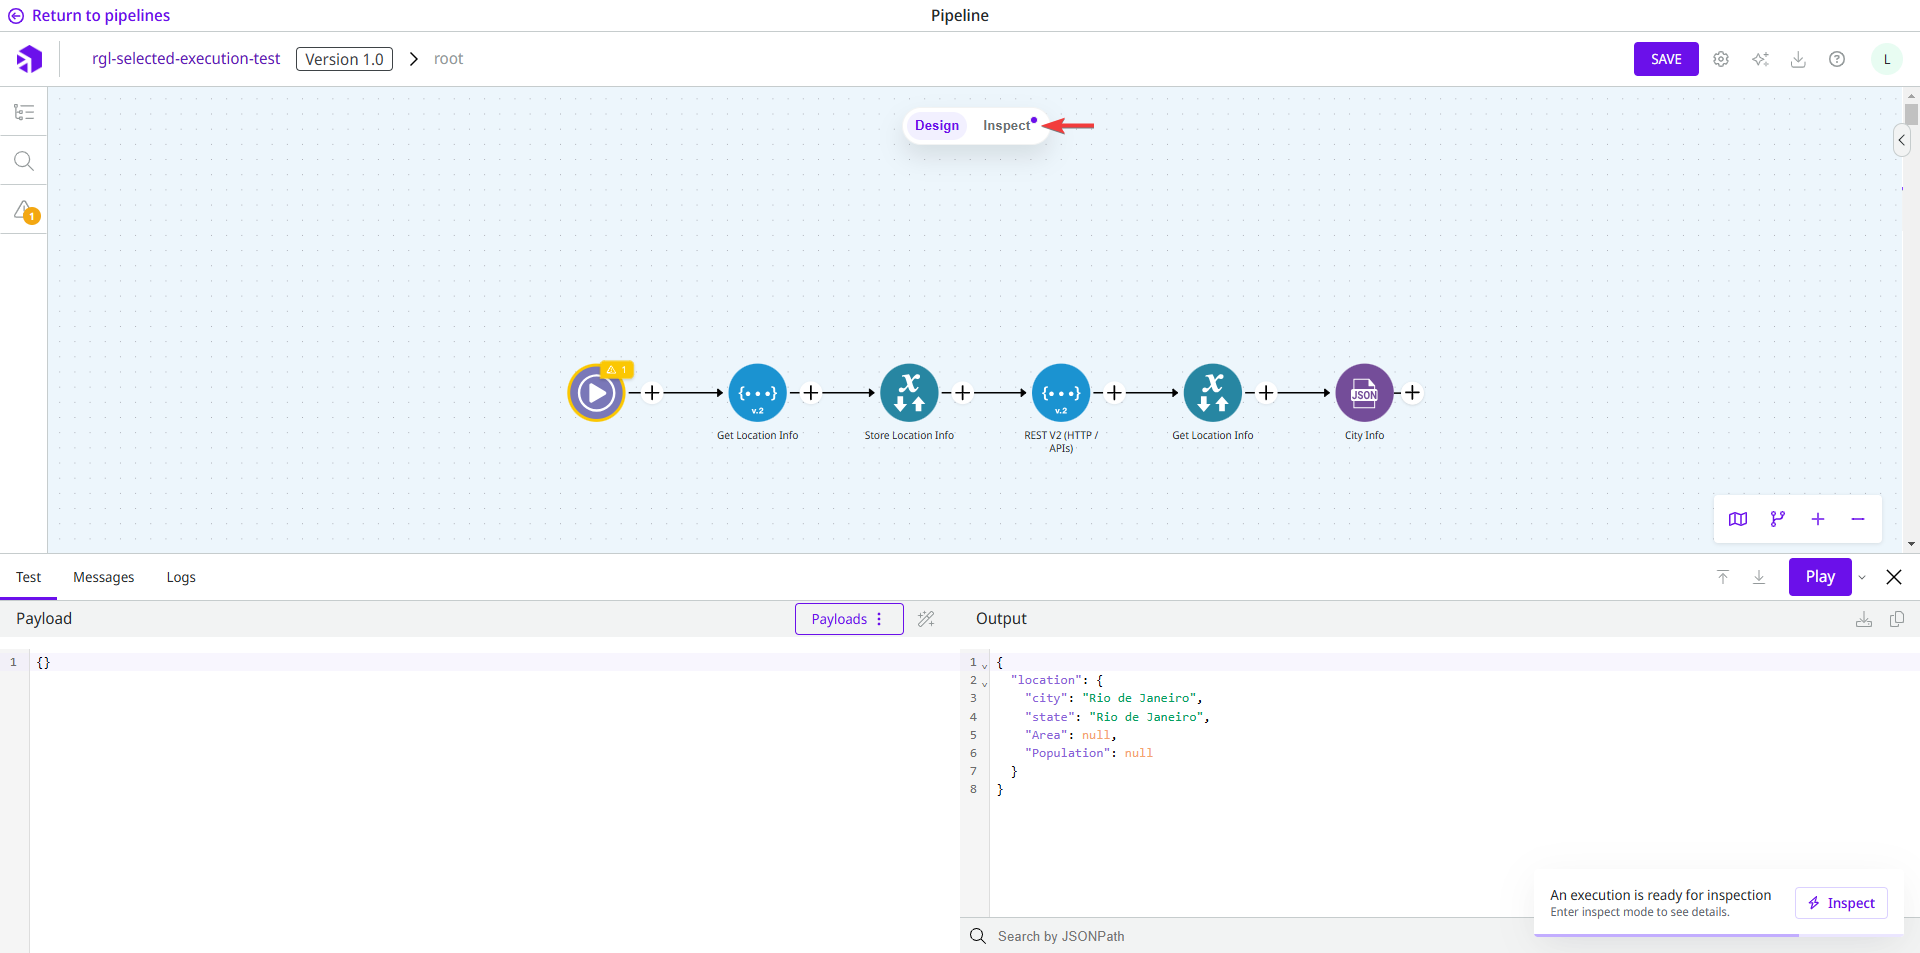
To activate the Inspect Mode, you must open the Execution panel in Design Mode and run the flow. The Inspect Mode is activated when messages are present in the execution. A notification is displayed on the page to let you know that an execution is ready for inspection.
Inspect Mode is not available if:
The flow is not executed.
No message was generated during execution or the number of messages is insufficient.
The limit of 5000 messages has been reached. In this case, you can limit the number of loops or reduce the size of the pipeline.
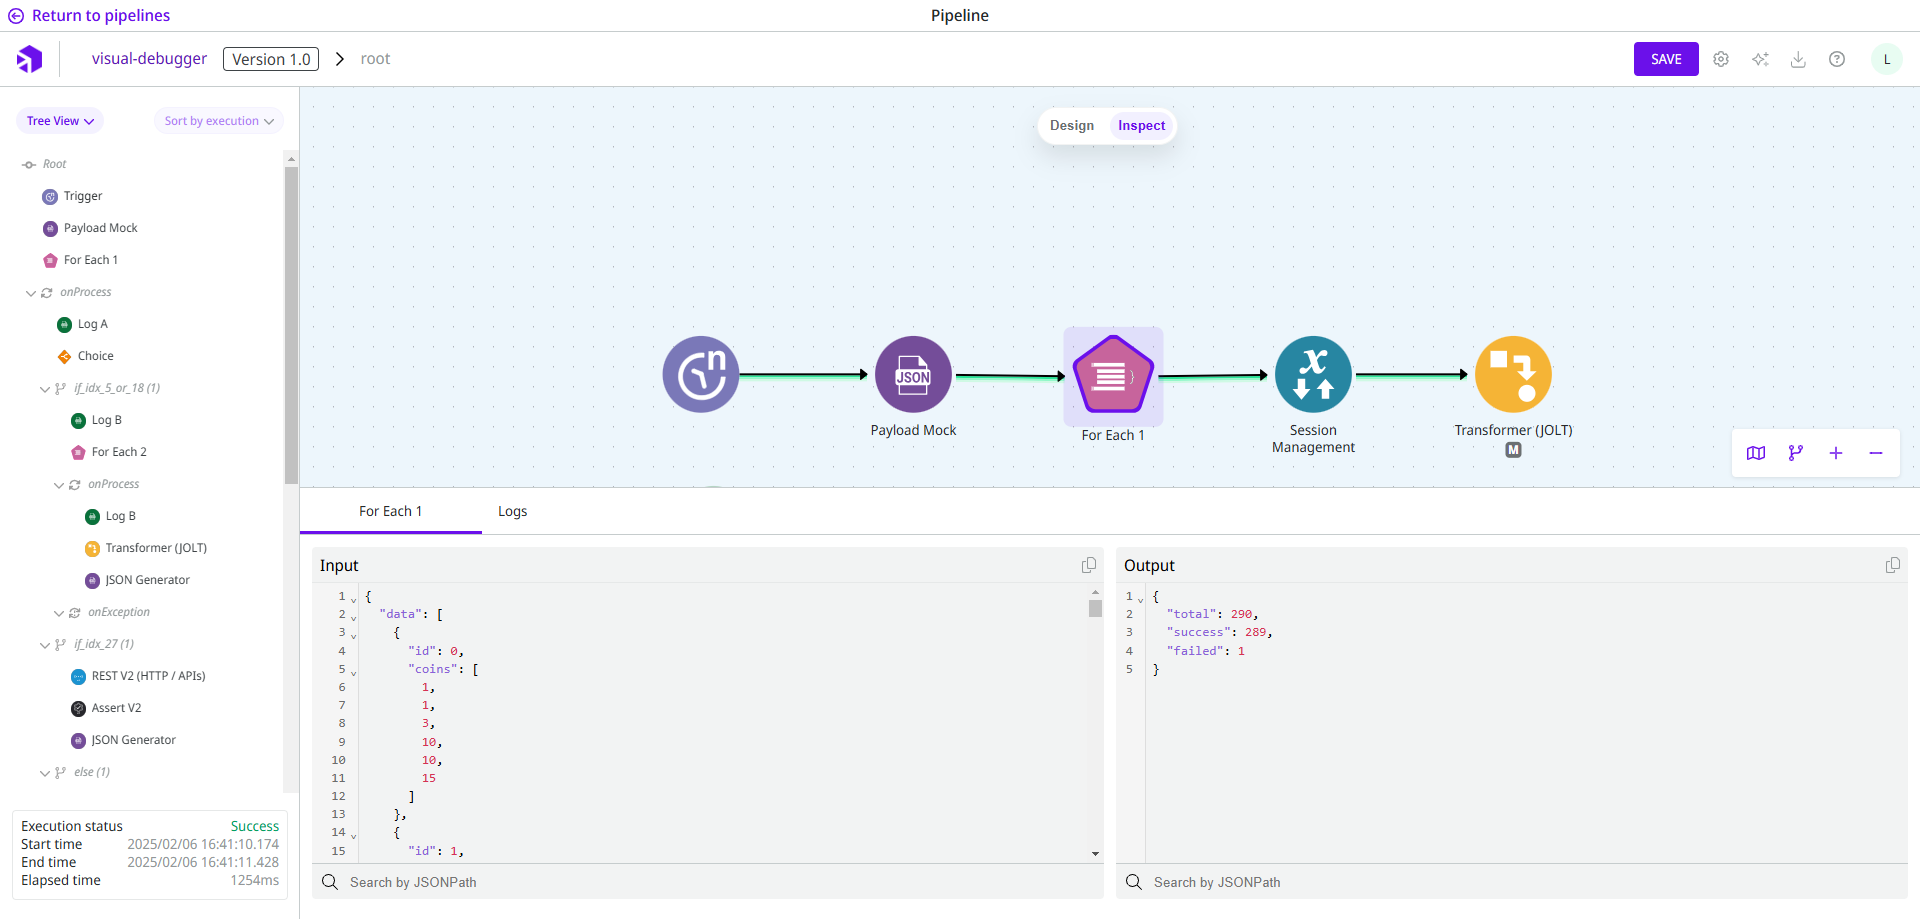
Once the flow has been executed, you must click the Inspect button at the top of the Canvas to enter Inspect Mode, as shown in the figure below.
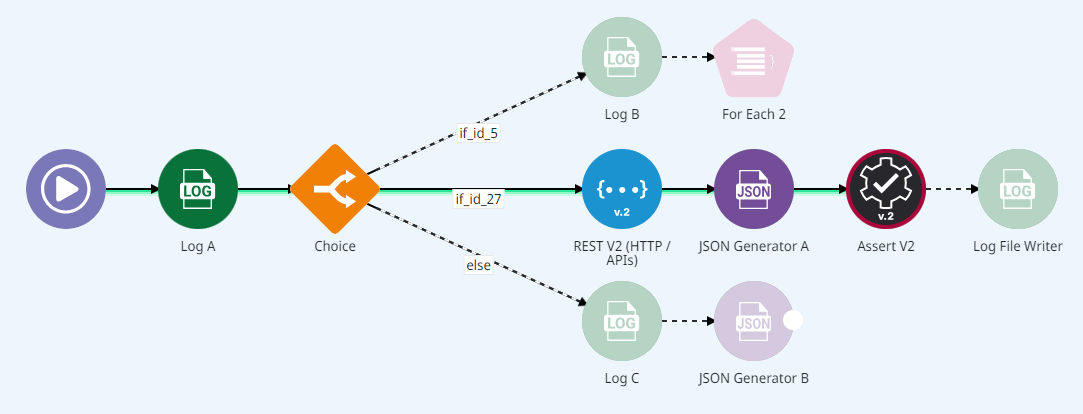
In Inspect Mode, a green line highlights the execution path. Dashed lines and grayed-out connectors indicate the parts of the flow that were not executed, while red connectors indicate a failed execution.
See an illustration of these visual elements:
This mode is read-only, so you can’t edit the flow while you are in it. To edit the flow, you must switch back to Design Mode by clicking the Design button.
Changes in Design Mode won’t be visible in Inspect Mode until you execute the flow again. This makes comparison easier, since you can visualize the old flow while editing the current flow.
Inspect Mode navigation
Left Panel
The Left Panel in the Canvas displays the flow’s connectors in two ways: Messages and Flow Tree.
Messages
In Messages, you can view a list of executed connectors for the current level or loop iteration, which can be sorted by:
Execution order: Connectors are listed in the order they were executed.
Execution time: Connectors are listed by their execution time in descending order (from the longest time to the shortest time).
To view more details about a connector’s input and output messages, click the desired connector. To locate the connector in the flow, double-click it.
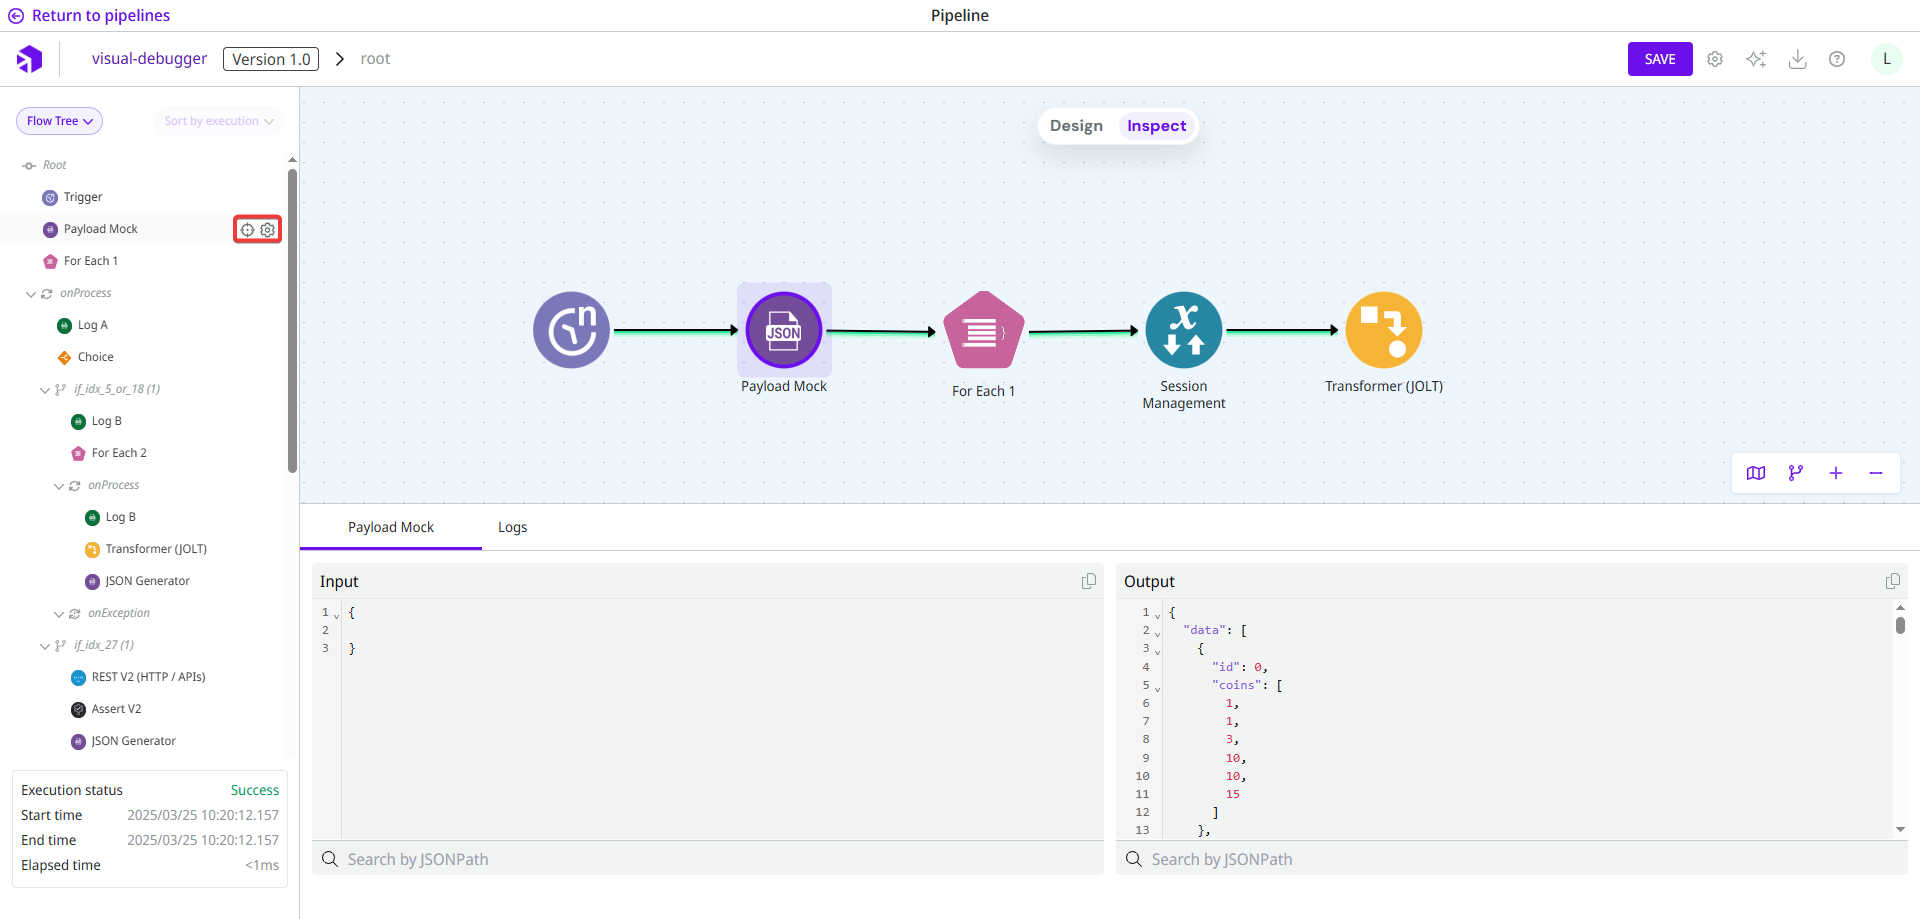
Flow Tree
The Flow Tree provides a complete view of your flow in a tree structure in which all connectors (connected or not connected to the flow) and subflows are displayed.
In the Flow Tree, you can:
Click the focus icon to locate the connector in the flow.
Click the gear icon to open the connector’s configuration form in read-only mode.
Connector details
At the bottom of the panel, you can access detailed information about the connector. This information can be accessed by:
Clicking the connector in the flow.
Selecting it in the Messages list.
The available details include:
Execution status: The execution status, either
SuccessorFailed.Start time: The start time of the connector’s execution in
YYYY/MM/DD HH:mm:ss.SSS.End time: The end time of the connector’s execution in
YYYY/MM/DD HH:mm:ss.SSS.Elapsed time: The total execution time in milliseconds.
Lower Panel
The Lower Panel in the Canvas provides access to the Step Info and Logs tab.
Step Info
This tab displays the input and output of the selected connector in read-only mode. You can also search for specific JSONPath expressions within the Input and Output columns.
Logs
If logs are generated by the selected connector during execution, they are available on the Logs tab.
Loops in Inspect Mode
Some connectors used in the flow can create loops. These connectors are:
When a loop is created, you can navigate through the index loops in the navigation menu at the bottom of the Canvas. The three ways to navigate are:
Using the arrows.
Clicking the three dots to open the index you want.
Entering the index loop in the Go to field.

The current loop index is displayed in two places: in the navigation menu at the lower center of the Canvas and in the breadcrumb at the upper left corner, enclosed in brackets. For example, “For Each 1 (onProcess) [27]” indicates that the current loop index is 27.
Loop within a loop
A flow can contain loops within loops. If you are in an OnProcess and want to enter another OnProcess in Inspect Mode, two different scenarios can occur:
Scenario 1: Accessing the OnProcess of a connector that has been executed
Suppose you are in the OnProcess of a For Each connector (referred to as For Each A) and viewing loop number 2. At this point, the flow is:
root > For Each A (onProcess) [2]
Within loop 2 of this OnProcess, there is another For Each connector (For Each B) that has been executed. When you access the OnProcess of For Each B, the subflow displayed will continue from the execution path of the previous level.
The flow now appears as:
root > For Each A (onProcess) [2] > For Each B (onProcess) [0]
Scenario 2: Accessing the OnProcess of a connector that was not executed
Now, let’s assume you are back in the OnProcess of For Each A, but this time in loop number 5. At this point, the flow is:
root > For Each A (onProcess) [5]
In loop 5, For Each B was not executed, but you can still access its OnProcess. Inspect Mode automatically aligns the subflow to the last executed path of For Each B.
Since For Each B was executed in loop 2, the breadcrumb updates to:
root > For Each A (onProcess) [2] > For Each B (onProcess) [0]
If you return to the For Each A level, the breadcrumb will display loop 2 instead of loop 5.
Import execution in Inspect Mode
When you import an execution into the Canvas, the Inspect Mode is activated, allowing you to analyze the execution in read-only mode.
The execution is opened in Inspect Mode only if it was exported after the release of the Design and Inspect Mode feature.
Last updated
Was this helpful?