
How to send pipeline logs to external monitoring systems
Learn how to export integration pipeline logs to external monitoring systems outside the Digibee Integration Platform.
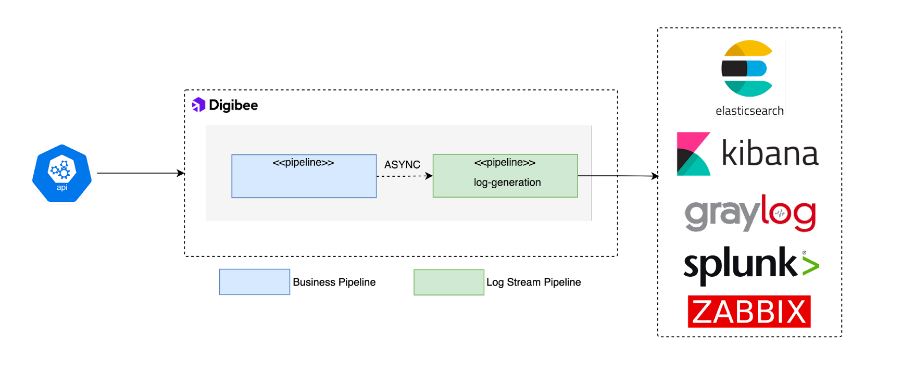
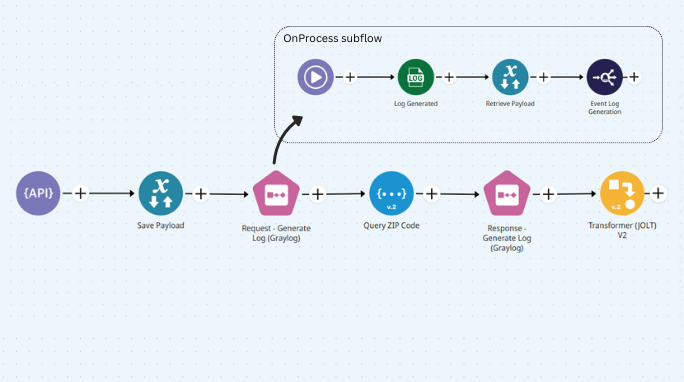
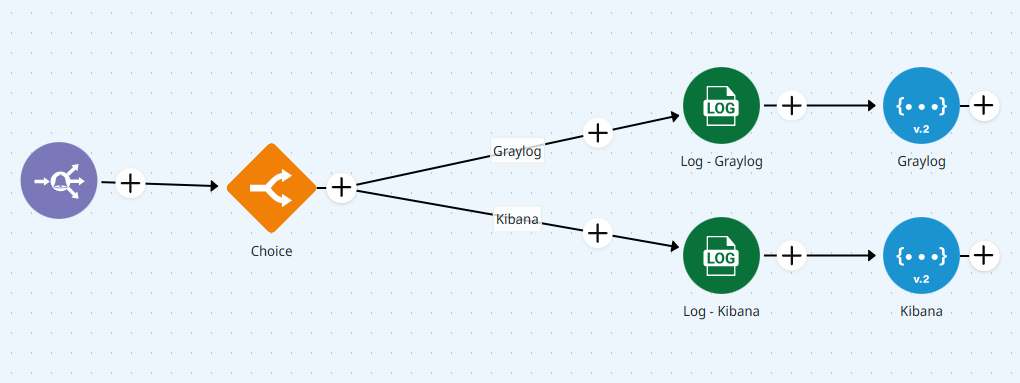
Architecture: Log Stream pattern
1
Additional information
Best practices for external log calls
Alternative: Use capsules
Practice challenge
PreviousHow to resolve the "Pipeline execution was aborted" errorNextHow to build integration flows that send error notifications
Last updated
Was this helpful?